Add'l-4: Single-cell analysis
In this tutorial we will be analysing and annotating a 10x Genomics PBMC single cell gene expression dataset that has been pre-processed using the Seurat R package. One of the first analyses of interest for single cell datasets is the identification of cell types. We will be using an R package, RCAv2, for this purpose.
RCAv2 combines reference projection, allowing for robustness to batch effects, with graph-based clustering, allowing for scalability in analyses (Schmidt et al., 2021). The RCAv2 R package contains reference panels for human and mouse, allowing users at all levels of scientific background and knowledge to quickly annotate cell types that are present in both their datasets and the RCAv2 reference panels. This also facilitates cell type-specific quality control measures.
We will focus on the reference projection functions within the RCAv2 R package in this session. These functions project query single cell gene expression profiles of interest against reference transcriptomes in the RCAv2 reference panels, and allow for identification of major cell types present in the dataset.
1. Process a 10x Genomics PBMC single cell gene expression dataset
Today we will analyse a pre-processed Seurat object. We have performed quality control measures and used the Louvain method for clustering on this dataset. For a sample pre-processing workflow, please see the Satija Lab Seurat Guided Clustering Tutorial.
We have made this pre-processed object available as “pbmc3k_final_withoutRCA2.rds”. We will perform dimensionality reduction for visualisation of the dataset:
mkdir /home/ubuntu/single-cell
cd /home/ubuntu/single-cell

# Download the data needed for this exercise
aws s3 cp s3://gisxaws-training/pbmc3k_final_withoutRCA2.rds .

# Now we'll open the R environment
R
We will now load the required libraries and pre-process the data file.
# Conduct the following in R:
library(dplyr)
library(Seurat)
pbmc_withoutRCA <- readRDS(file = "pbmc3k_final_withoutRCA2.rds")
pbmc_withoutRCA <- RunUMAP(pbmc_withoutRCA, dims = 1:10)
Seurat <- DimPlot(pbmc_withoutRCA, reduction = "umap", group.by = "seurat_clusters", label = TRUE, label.size = 5)+
NoLegend()
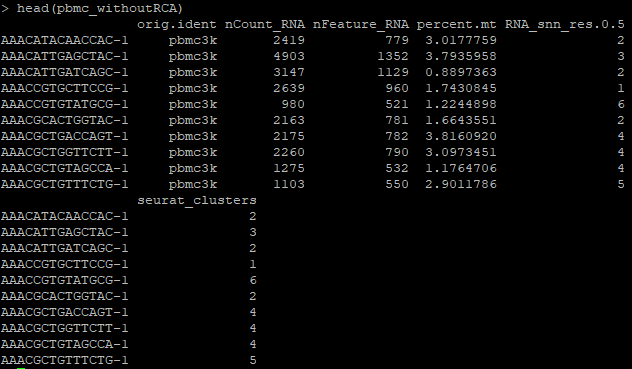
head(pbmc_withoutRCA)
Take a look at the metadata for this Seurat object, prior to the addition of cell annotations.
Observe that the pbmc_withoutRCA file is without annotations prior to running RCAv2.
2. Use the RCAv2 package to identify major cell types by projecting single cell gene expression profiles against reference transcriptomes
Now let us analyse the above Seurat object and add cell annotations using RCAv2:
library(RCAv2)
pbmc <- pbmc_withoutRCA
a. Identify major cell types present in the dataset using the RCAv2 R package:
RCA_from_Seurat<-RCAv2::createRCAObject(pbmc@assays$RNA@counts, pbmc@assays$RNA@data)
RCA_from_Seurat<-RCAv2::dataProject(rca.obj = RCA_from_Seurat)
RCA_from_Seurat<-RCAv2::dataClust(RCA_from_Seurat)
RCA_from_Seurat<-RCAv2::estimateCellTypeFromProjection(RCA_from_Seurat)
b. Add annotations from RCAv2 to the Seurat object:
df_RCA_cell <- data.frame(barcode = colnames(RCA_from_Seurat$projection.data),
                          cell = unlist(RCA_from_Seurat$cell.Type.Estimate))
rownames(df_RCA_cell) <- df_RCA_cell$barcode
pbmc$RCA.proj.cell <- df_RCA_cell[colnames(pbmc),"cell"]
c. Aggregate annotations from RCAv2 per Seurat cluster and view the results:
df_RCA_results <- FetchData(pbmc, vars = c("seurat_clusters","RCA.proj.cell"))
df_RCA_results$count <- 1
df_RCA_results <- aggregate(count ~ ., df_RCA_results, FUN = sum)
df_RCA_results <- df_RCA_results %>% group_by(seurat_clusters) %>% top_n(n = 5, wt = count)
df_RCA_results <- df_RCA_results[order(df_RCA_results$seurat_clusters),]

vec_RCA_cluster_annotations <- (df_RCA_results %>% filter(count == max(count)))$RCA.proj.cell

for (i in 0:(length(vec_RCA_cluster_annotations)-1)){
  print(df_RCA_results %>% filter(seurat_clusters == i))
}
d. Annotate each cell with its Seurat cluster’s RCAv2 annotation:
df_umap_cluster_RCA2 <- FetchData(pbmc, vars = c("UMAP_1","UMAP_2","seurat_clusters"))
df_umap_cluster_RCA2$cell <- NA
for (i in 0:(length(vec_RCA_cluster_annotations)-1)){
df_umap_cluster_RCA2[which(df_umap_cluster_RCA2$seurat_clusters==i),"cell"] <- vec_RCA_cluster_annotations[i+1]
}
pbmc$RCA.annotation <- df_umap_cluster_RCA2[colnames(pbmc),"cell"]
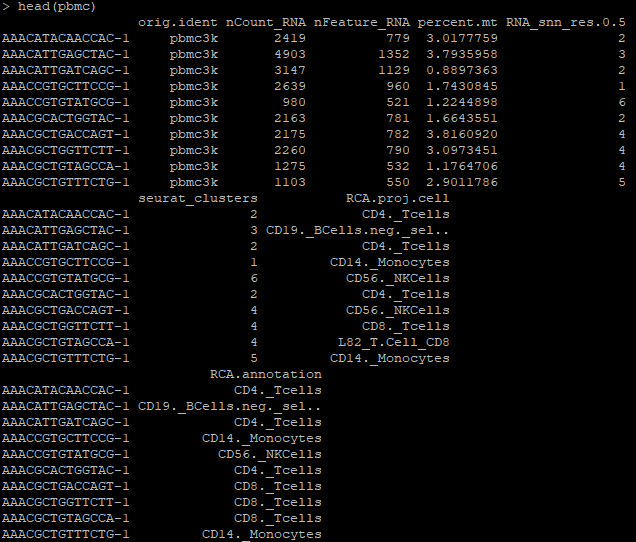
head(pbmc)
Observe that the pbmc object now contains RCA annotations:
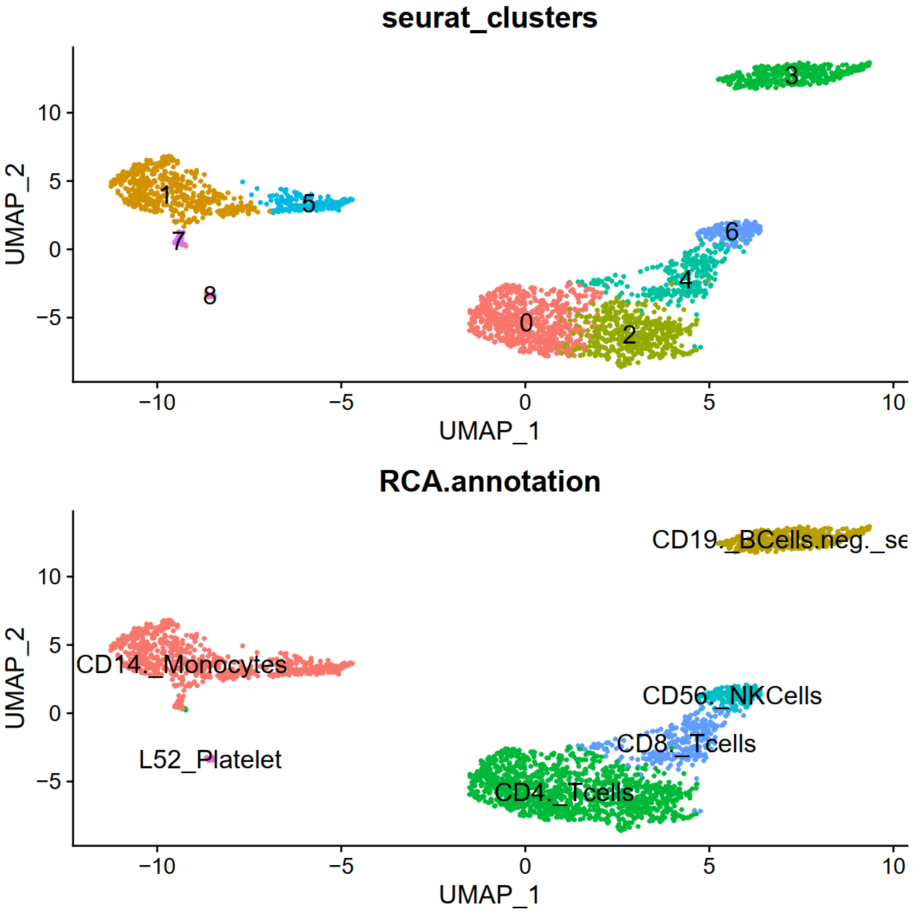
e. Finally, visualise UMAP with RCA annotations:
RCA <- DimPlot(pbmc, reduction = "umap", group.by = "RCA.annotation", label = TRUE, label.size = 5)+
  NoLegend()
gridExtra::grid.arrange(Seurat,RCA,ncol=1)

# Save your plot to an output file
pdf('Seurat_RCA.pdf')
gridExtra::grid.arrange(Seurat,RCA,ncol=1)
dev.off()

# Exit R; type in 'n' in response to "Save workspace image?"
q()
n
You can now inspect the plots in Seurat_RCA.pdf by transferring this file to your local machine. Refer to the page discussing Remote Data Transfer - Step 4.
Optional: We can try a few more analyses and visualizations using the pre-processed Seurat object, such as:
1) Identifying marker genes in single cell datasets
2) Visualising marker gene expression in single cell datasets
# Make sure to open the R environment
R
# Load your resources; make sure you've downloaded the data file (above)
library(dplyr)
library(Seurat)
pbmc <- readRDS(file = "pbmc3k_final_withoutRCA2.rds")
# Identify marker genes for every cluster compared to all other cells
pbmc.markers <- FindAllMarkers(pbmc, only.pos = TRUE, min.pct = 0.25, logfc.threshold = 0.25)
vec_marker_genes <- (pbmc.markers %>%
group_by(cluster) %>%
slice_max(n = 2, order_by = avg_log2FC))$gene
# Plot raw counts of marker genes of interest, and visualise marker gene expression
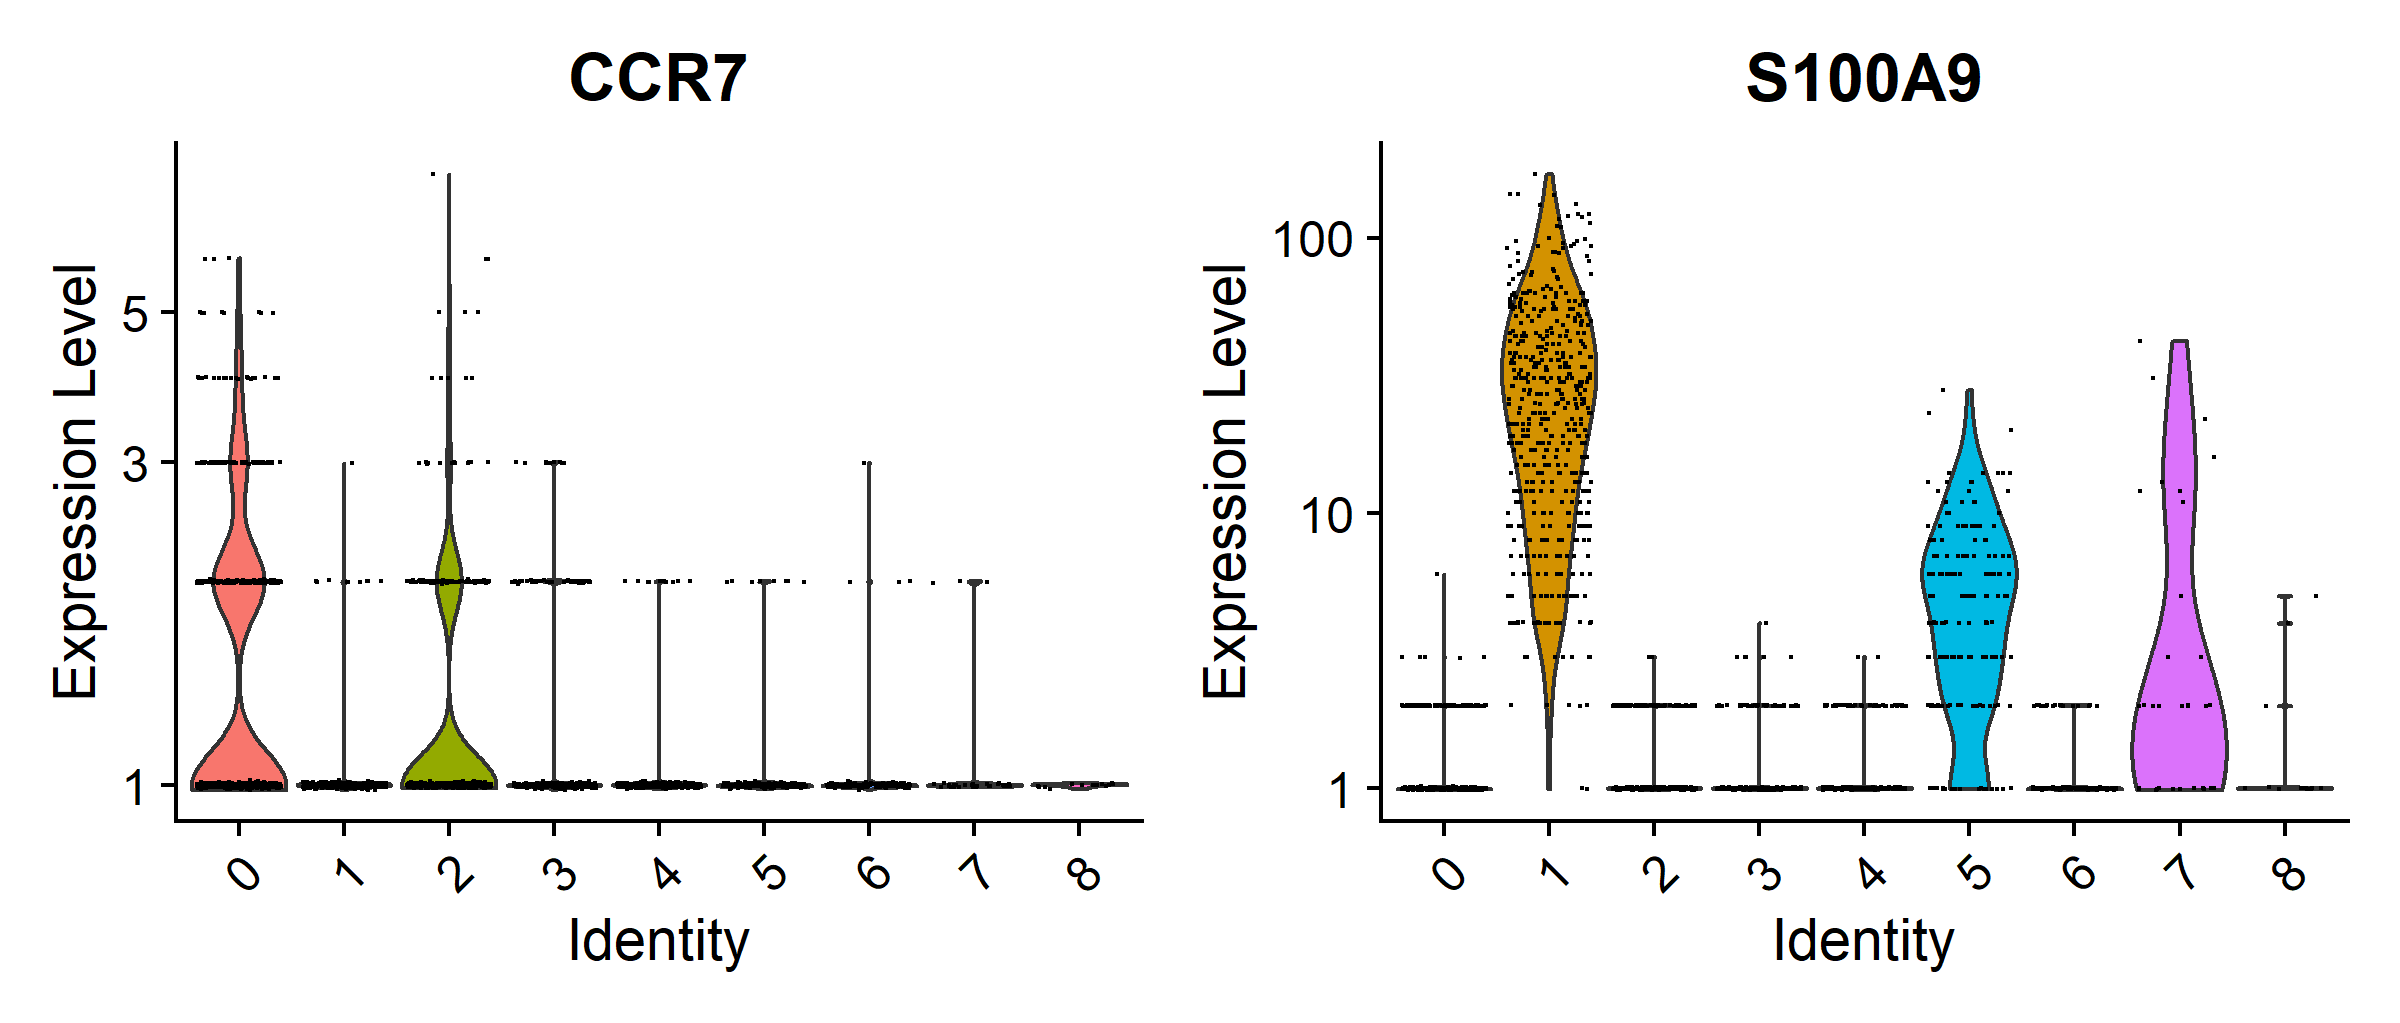
VlnPlot(pbmc, features = c(vec_marker_genes[1], vec_marker_genes[3]), slot = "counts", log = TRUE)
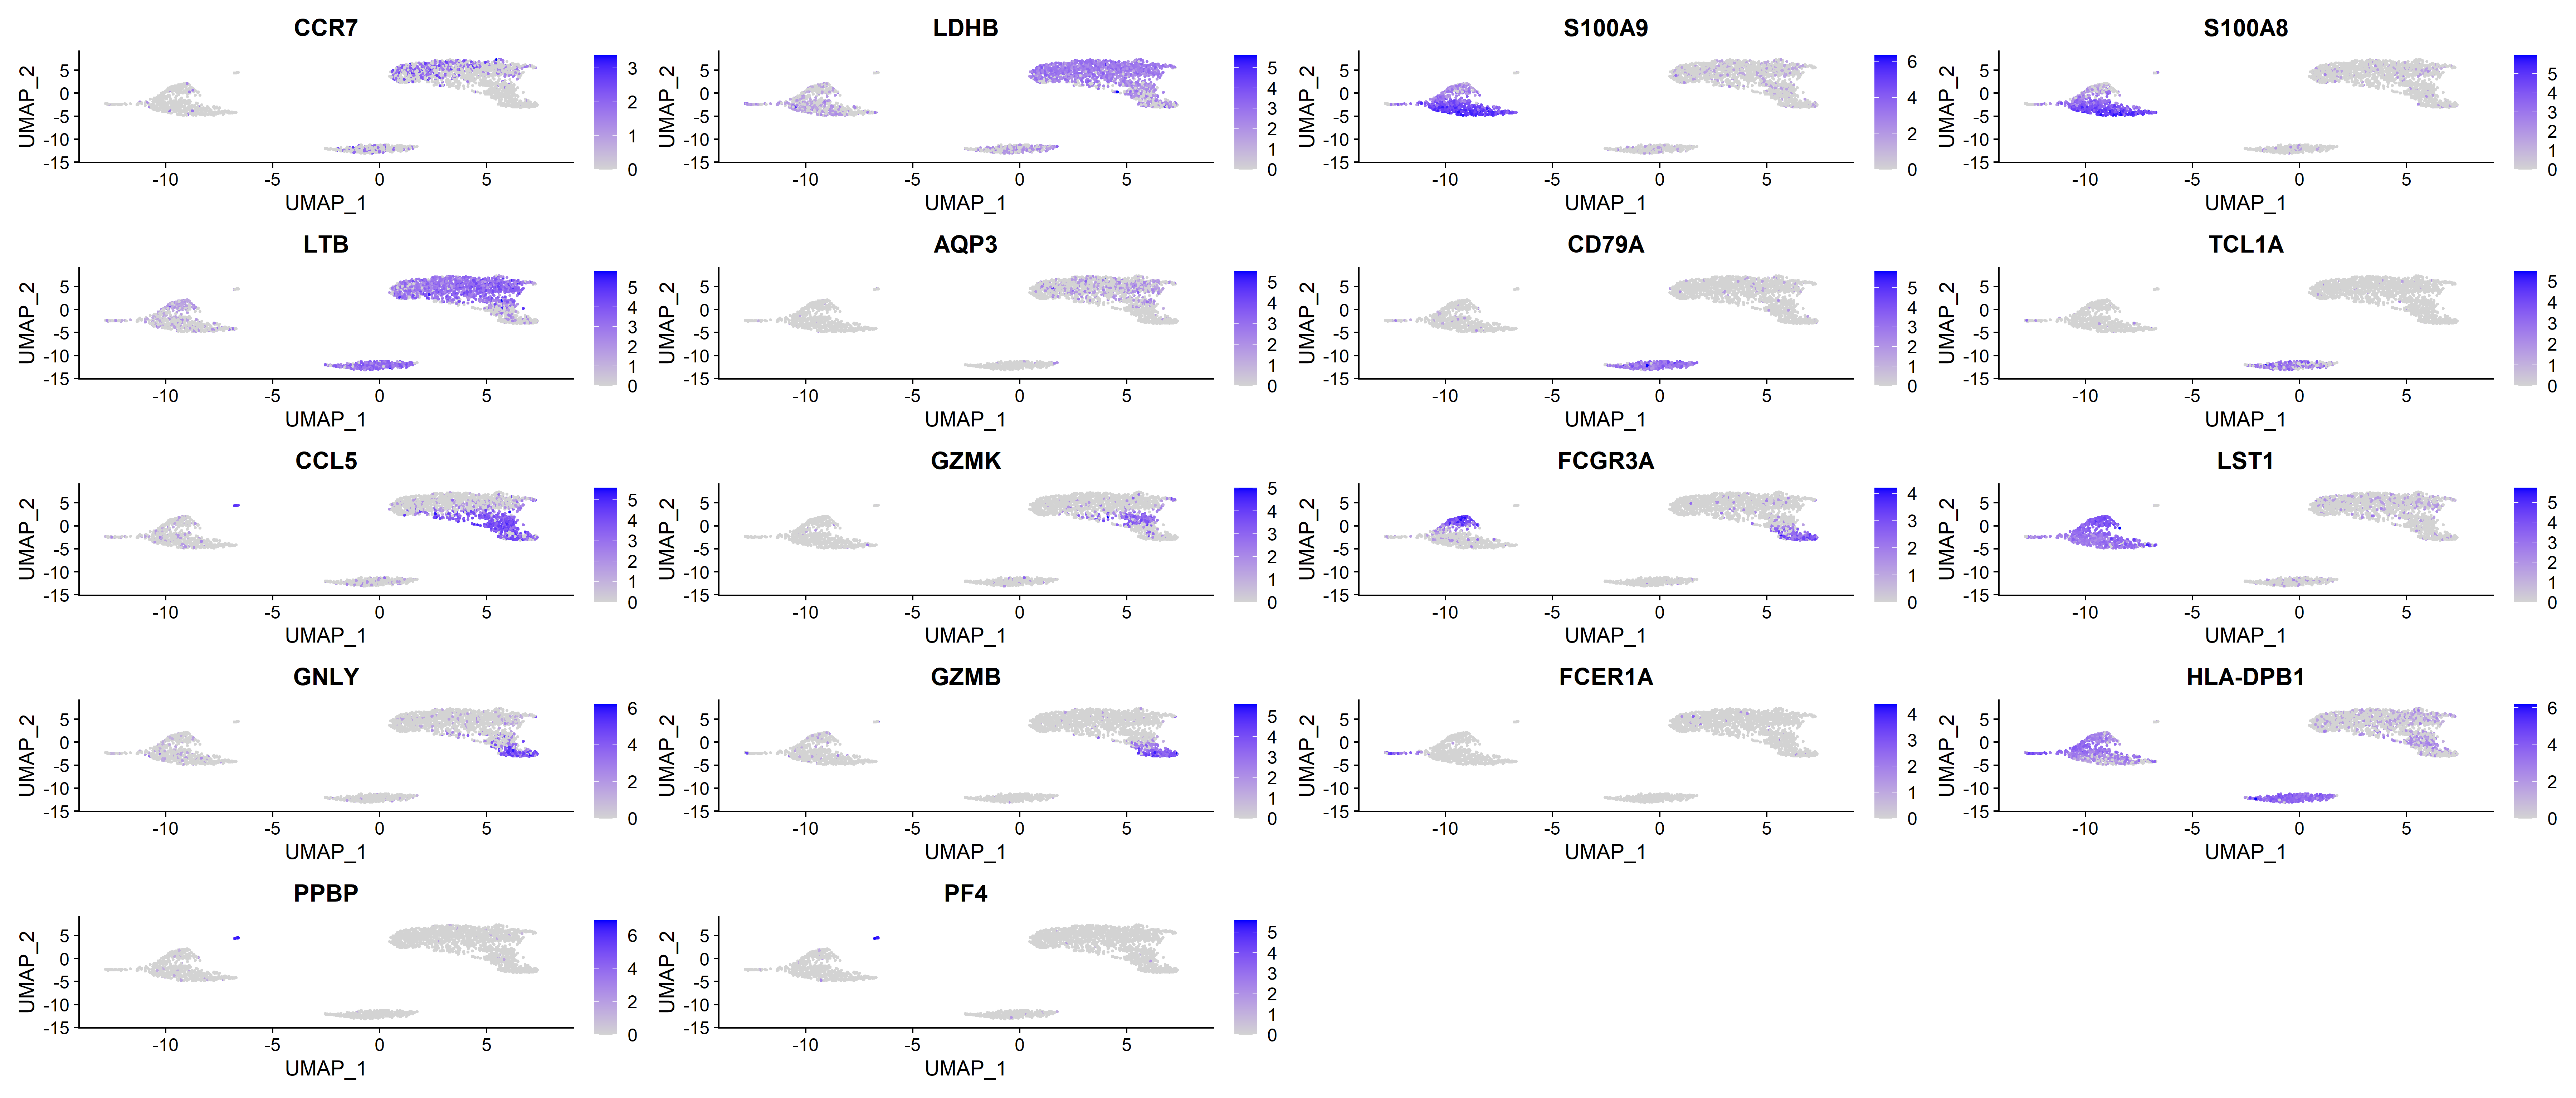
FeaturePlot(pbmc, features = vec_marker_genes)
dev.off()
q()
These plots provide the specific expression level of different marker genes and visualise the expression of different marker genes across the different clusters. Feel free to explore this dataset further.